Research

Research

Civilian harm in the Battle of Kharkiv

Heatmap of where civilians were harmed during the 79-day battle

As part of our on-going research mapping the human cost of war in urban environments, the following visualisation demonstrates all civilian casualty allegations in the densely populated city of Kharkiv between February 24th to May 13th 2022.

Airwars documented 68 incidents of civilian harm reported by local sources in Kharkiv city during the intense campaign, accounting for at least 83 casualties and up to 365 civilians injured.

In Kharkiv city, the highest number of incidents of civilian harm were reported in Saltivskyi, in Kyivsky and Shevchenkivskiy city districts, the northern and eastern parts of the city. In September 2022, Kharkiv Mayor Ihor Terekhov said in an interview that ‘there are some residential areas where there is nothing left’.

This visualisation accompanies Airwars’ casualty archive for Ukraine. Read more in our research brief here, and navigate the full archive here.

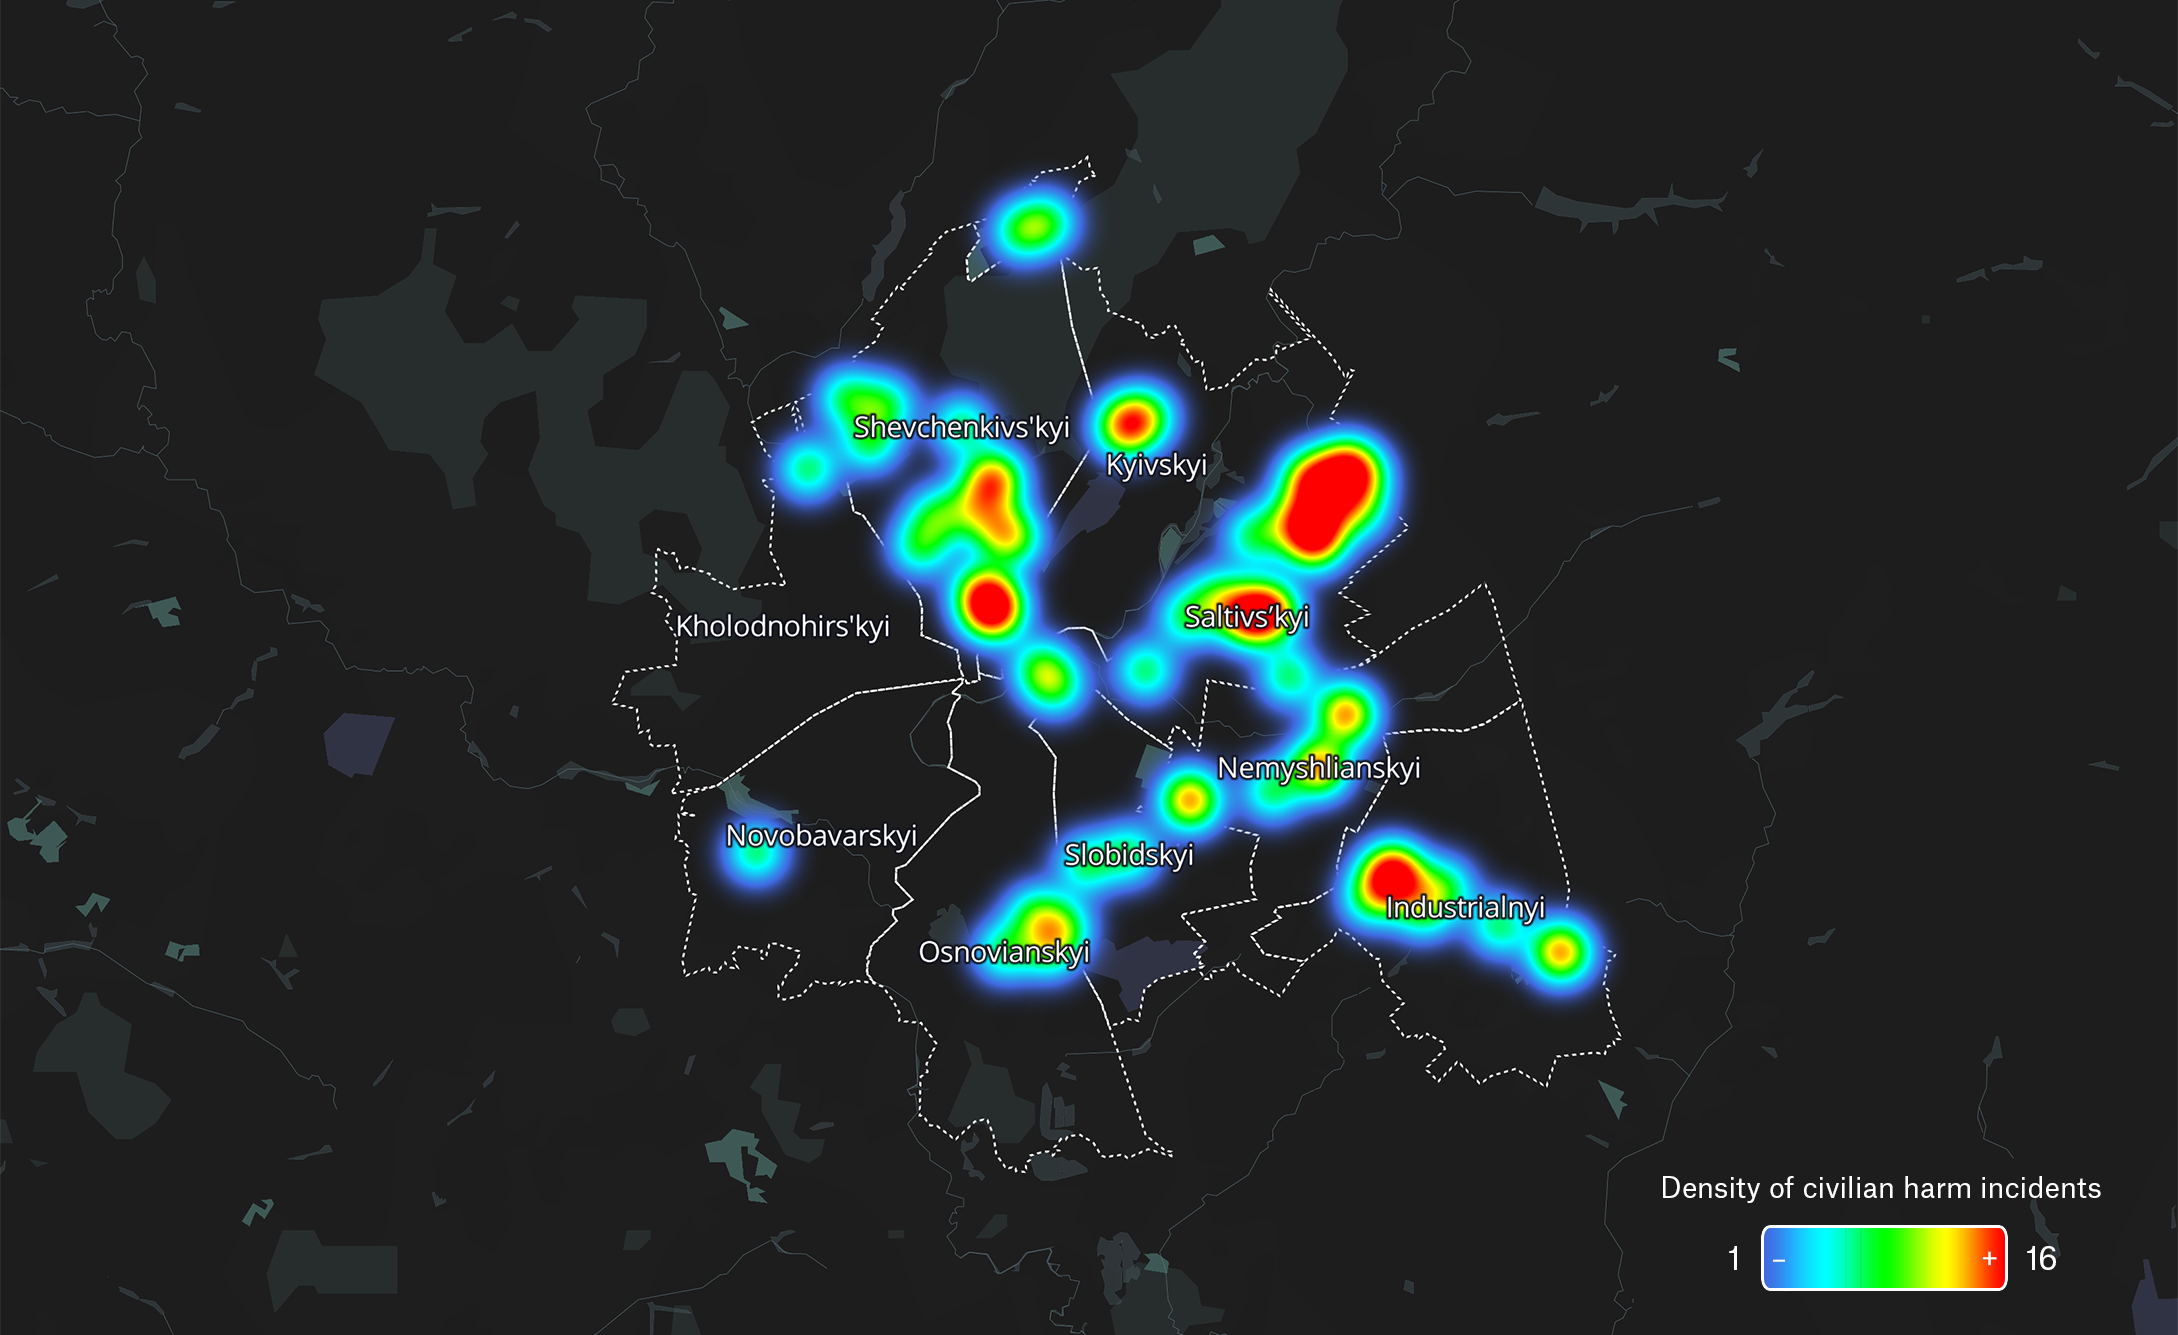
Heat map of all civilian harm incidents in the city of Kharkiv resulting from alleged Russian artillery and airstrikes during the Battle of Kharkiv, February 24th to May 13th 2022 at Street, Area, Nearby Landmark, and Exact Location accuracy.

Mapping urban warfare

These maps are the first in a series of visualisations Airwars is presenting ahead of a new political declaration that calls on states to better protect civilians from the use of explosive weapons in populated areas.

By matching neighbourhood population density – which also usually coincides with high levels of civilian infrastructure – with Airwars’ archive of civilian harm, we demonstrate the deadly human toll and the impact of urban warfare in cities and towns.

Spotlight on Mosul

During the Battle of Mosul, the US-led Coalition used over 29,000 bombs, missiles and rockets on the city to help defeat ISIS. Airwars records of civilian harm indicate that at least 5,680 civilians were reported killed – though some casualty estimates reach over 9,000.

Airwars has documented this profoundly troubling trend, time and again, where modern warfare is increasingly taking place in urban areas.

Map 1: This map of Mosul shows the devastating and deadly effects of heavy fighting in highly urbanised and populated neighbourhoods - between 2016 - 2017. The map splits Mosul up into local neighbourhoods - the taller the neighbourhood, the greater the number of casualties. Areas with the highest population density are indicated in green. As the map shows - the higher the density, the more casualties were recorded. The most number of civilians were alleged killed in Sheikh Fathi neighbourhood, where at least 1,079 civilian deaths were recorded. Population density data according to Central Statistics Organisation (COSIT), Iraq, August, 2016. Civilian casualty data presents minimum estimates across all civilian harm allegations recorded by Airwars.

Map 2: This heatmap shows evidence of building damage during the Battle of Mosul (2016 - 2017) as recorded by UNOSAT from 2017. Building damage refers to substantial structural damage seen from satellite imagery over the period of the conflict. According to city officials, in some parts of the city 80 percent of buildings were destroyed. In the recently published RAND Report, Understanding Civilian Harm in Raqqa and Its Implications for Future Conflicts, RAND estimates that the ratio of buildings destroyed or damaged in Mosul to civilians killed was 1:1.