Mapping urban warfare
This is the latest visualisation in our series ‘mapping urban warfare‘, where we explore how explosive weapons affect civilians in populated areas – in line with a new political declaration restricting their use, signed by over 80 states.
Spotlight on the Gaza Strip
Produced in partnership with the Conflict and Environment Observatory (CEOBS), the map below explores the 11-day conflict in the Gaza Strip in May 2021. It includes data on civilian fatalities, collected and geolocated by Airwars, together with data on damage to critical water infrastructure – including ground measurement results from the UN Water Sanitation and Hygiene Cluster, satellite imagery, and local social media reporting. We use this as an indicator of the reverberating effects of conflict.
At least 151 civilians were reported killed in May 2021 – while the WASH cluster reported over 1 million civilians were affected by damage to wastewater infrastructure, for example without access to water treatment and sewage systems. Areas with high numbers of civilian casualties also saw significant damage to water infrastructure.
The images, geolocated by CEOBS, capture the outflow of untreated sewage into streets, inland lakes and the Mediterranean Sea. This was further exacerbated by damage to power infrastructure and fuel shortages, which were reported to have halted the operation of the undamaged wastewater treatment plants. Six months after the cessation of hostilities, temporary fixes to provide a minimum service were still incomplete, reportedly owing to a ban on imports of raw materials into the Gaza Strip.
As recently as November 2022, flash flooding was also identified in areas where wastewater infrastructure had been damaged in May 2021.
For detailed joint analysis from Airwars and CEOBS on the interconnected environmental factors relating to the conflict in the Gaza Strip, visit the CEOBS website here.
Static Gaza map showing (i) Green dots : WASH infrastructures either partially or completely destroyed by the conflict escalation. Of the 290 water infrastructure ‘objects’ damaged in the May 2021 escalation, 109 were linked to wastewater (such as wastewater treatment plants and sewage pipes). Data recorded in "Gaza WASH sector damage assessment - June 2021" by WASH Cluster - oPt. (ii) A heatmap of May 2021 civilian casualties based on Airwars data. The area coloured in the darkest red shows Northern Rimal neighbourhood, where the highest number of civilian casualty incidents occurred, cumulating at least 61 civilians likely killed, according to Airwars estimates. For an in-depth analysis of urban strikes, see our previous report "Why did they bomb us? Urban civilian harm in Gaza, Syria, and Israel from explosive weapons use" as well as our interactive map identifying civilian harm events. (iii) An inset imagery to several locations geolocated by CEOBS and satellite imagery of sewage discharges into the Mediterranean Sea by Planet.
Mapping urban warfare
These maps are the first in a series of visualisations Airwars is presenting ahead of a new political declaration that calls on states to better protect civilians from the use of explosive weapons in populated areas.
By matching neighbourhood population density – which also usually coincides with high levels of civilian infrastructure – with Airwars’ archive of civilian harm, we demonstrate the deadly human toll and the impact of urban warfare in cities and towns.
Spotlight on Mosul
During the Battle of Mosul, the US-led Coalition used over 29,000 bombs, missiles and rockets on the city to help defeat ISIS. Airwars records of civilian harm indicate that at least 5,680 civilians were reported killed – though some casualty estimates reach over 9,000.
Airwars has documented this profoundly troubling trend, time and again, where modern warfare is increasingly taking place in urban areas.
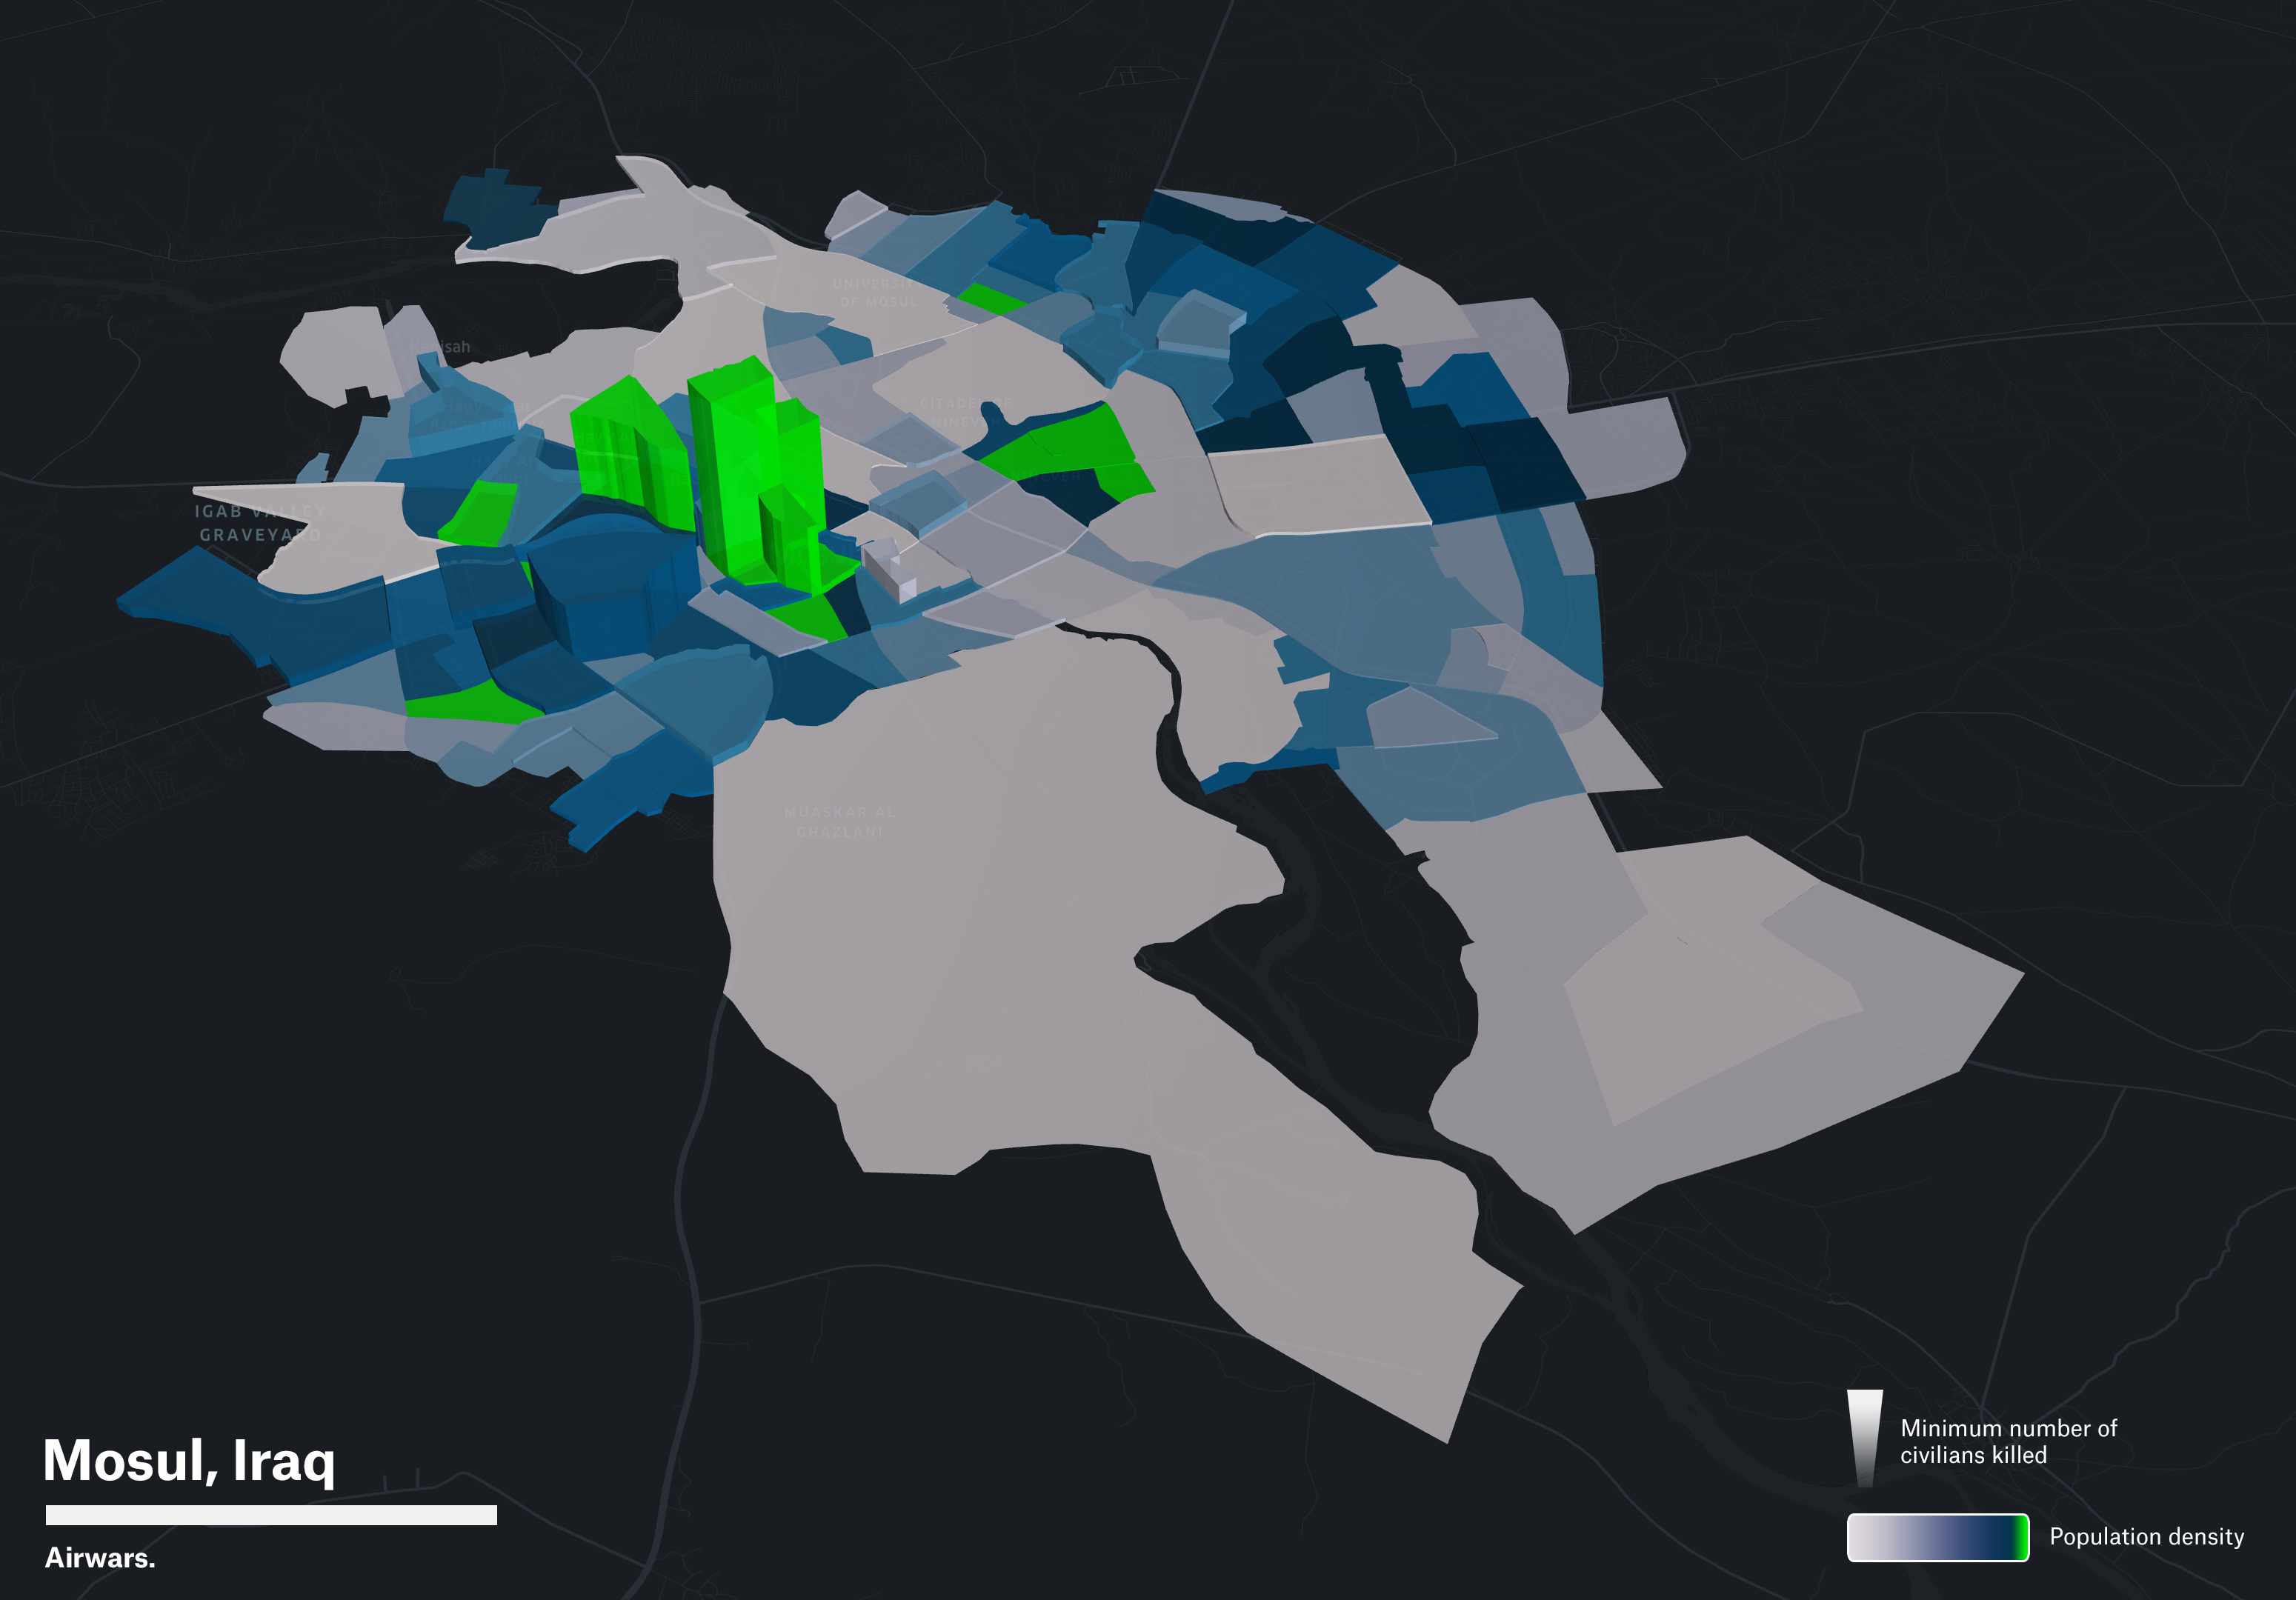
Map 1: This map of Mosul shows the devastating and deadly effects of heavy fighting in highly urbanised and populated neighbourhoods - between 2016 - 2017. The map splits Mosul up into local neighbourhoods - the taller the neighbourhood, the greater the number of casualties. Areas with the highest population density are indicated in green. As the map shows - the higher the density, the more casualties were recorded. The most number of civilians were alleged killed in Sheikh Fathi neighbourhood, where at least 1,079 civilian deaths were recorded. Population density data according to Central Statistics Organisation (COSIT), Iraq, August, 2016. Civilian casualty data presents minimum estimates across all civilian harm allegations recorded by Airwars.
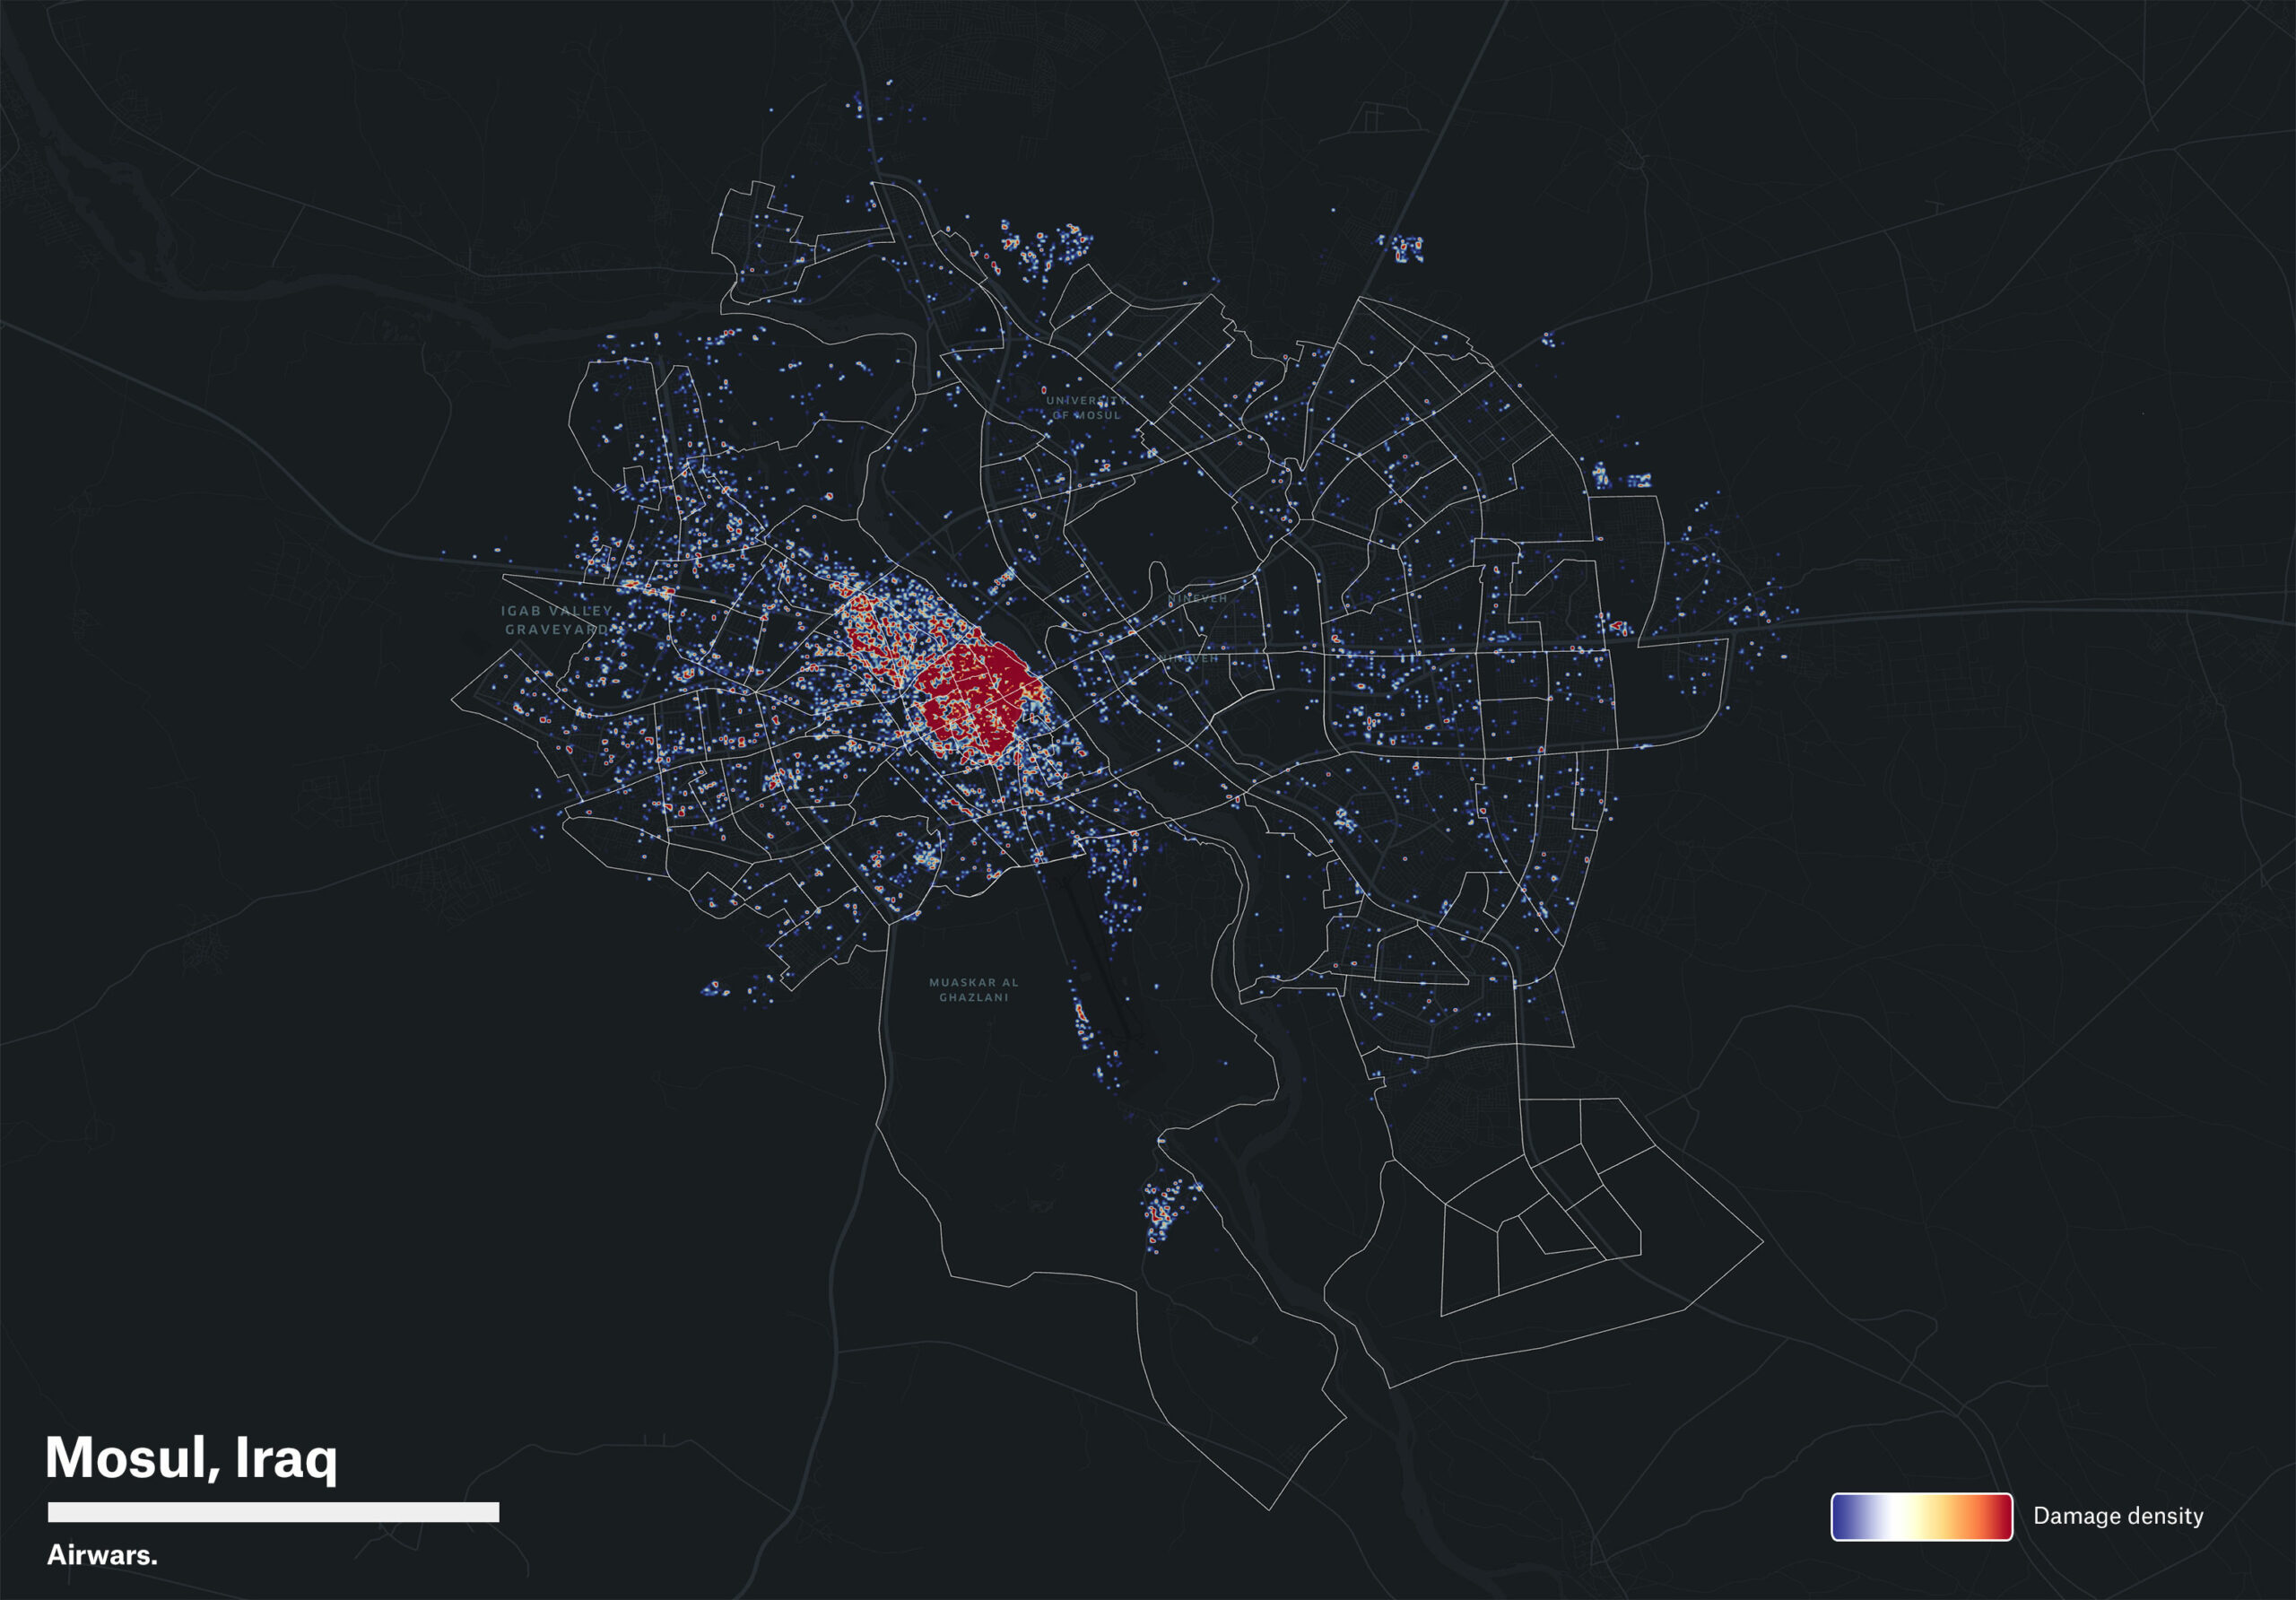
Map 2: This heatmap shows evidence of building damage during the Battle of Mosul (2016 - 2017) as recorded by UNOSAT from 2017. Building damage refers to substantial structural damage seen from satellite imagery over the period of the conflict. According to city officials, in some parts of the city 80 percent of buildings were destroyed. In the recently published RAND Report, Understanding Civilian Harm in Raqqa and Its Implications for Future Conflicts, RAND estimates that the ratio of buildings destroyed or damaged in Mosul to civilians killed was 1:1.