New graphics also compare airstrikes and reported civilian harm by recent US presidents in Iraq, Syria, Somalia.
In it latest data project, Airwars has published comprehensive mapping of more than 5,400 air and artillery strikes in Libya since 2012. The new data covers all known locally-reported strikes to date, conducted by all parties to an on-and-off civil war that is currently on pause, after last year’s UN-brokered ceasefire deal.
A team of researchers, geolocators and specialist volunteers for several months meticulously researched the location of every claimed strike event in as much detail as possible, placing the majority at least to neighbourhood level, and with many civilian harm events now including more exact locations. The new strike data joins more than 230 reported civilian harm events in Libya since 2012 which are already published by Airwars.
The new data and mapping has been visualised by Glasgow-based design studio Rectangle, an innovator when it comes to visualising conflict data. Daniel Powers and Lizzie Malcolm of Rectangle say about the project: “The new maps visualise these incidents by civilian fatalities, militant fatalities, and strikes carried out by each belligerent. The maps are navigable by a histogram of the map data over time, to try to provide an overview of a particularly complex conflict.”
The new interactive map enables users to explore the conflict in Libya and its impact on different regions of the country. Filters make it possible to see which faction bombed how much in which region; and who caused the most reported harm to civilians – revealing a clear correlation between the use of explosive weapons in urban areas and non-combatant deaths. According to Airwars modelling of local claims, the Libya conflict from 2012 to date has claimed the lives of up to 1,100 civilians through air and artillery strikes. Additionally the map also depicts claimed deaths among militant groups.
Claudia Gazzini, senior analyst at the International Crisis Group, says of the new mapping: “This is a great instrument that visualises extremely clearly how airstrikes have affected Libya throughout its ten-year transition. In a glance we see with extreme clarity where airstrikes have occurred, how many civilian casualties there have been as a result, and the presumed belligerent.”
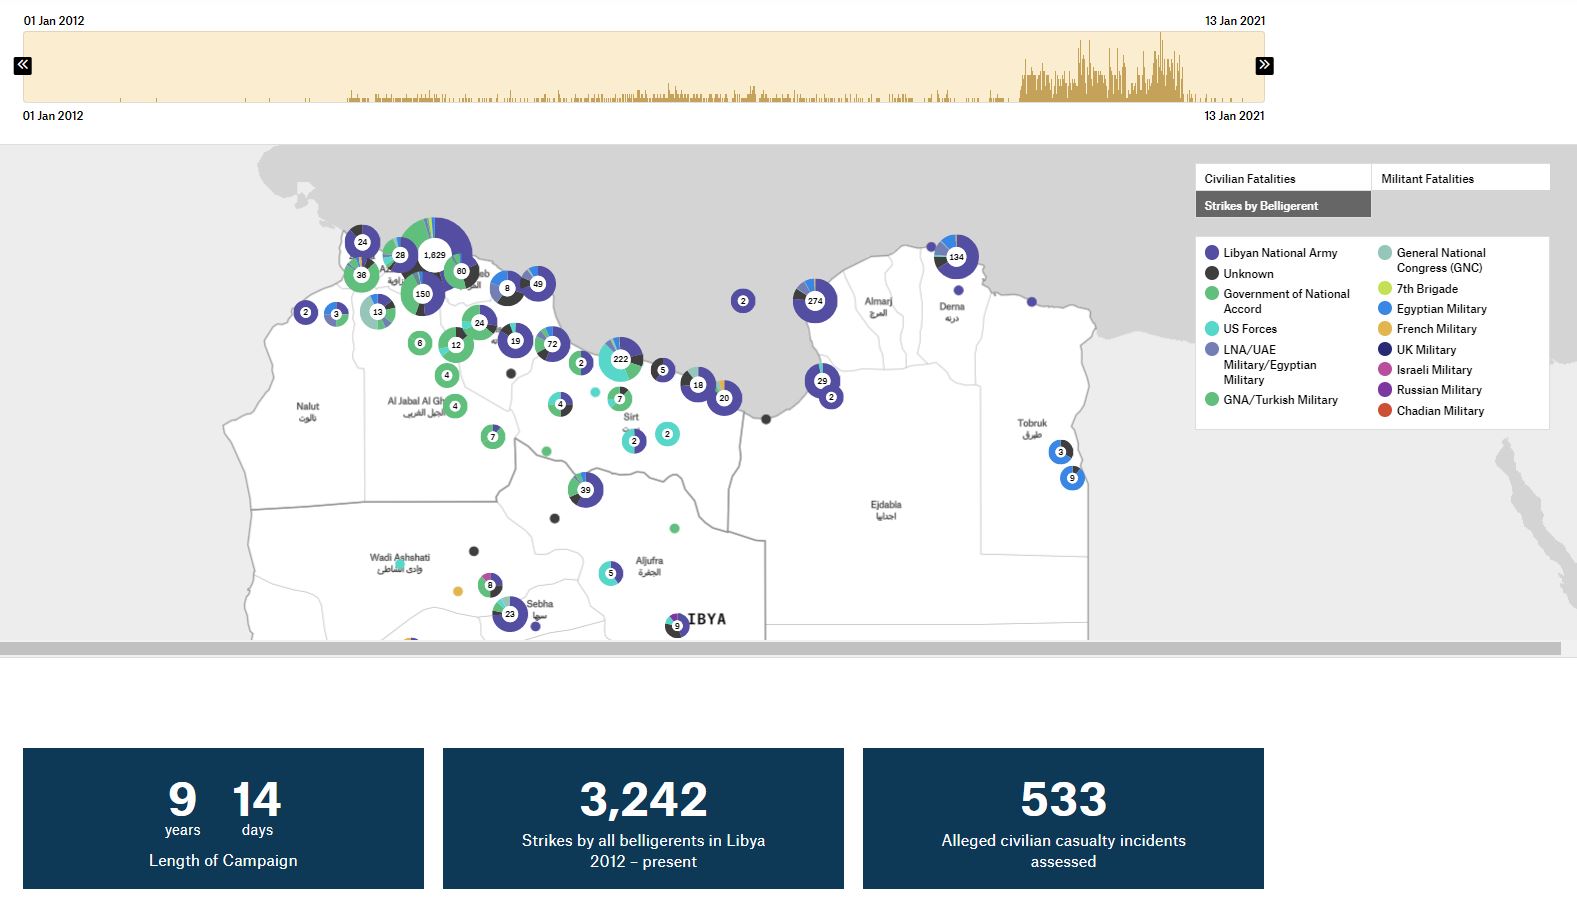
Overview of Airwars’ Libya mapping showing the whole range of the conflict
As a timeline above the mapping shows, Libya has witnessed intense periods of fighting since 2012 – with the LNA’s offensive on Tripoli between April 2019 and June 2020 by far the heaviest. Inga Kristina Trauthig, Libya Research Fellow at the ICSR think tank, recalls some of the shocking attacks that occurred during the war. “Buried in this quantitative data are infamous examples, such as the airstrike at a military school in the capital, Tripoli which killed over 30 people in January 2020; as well as numerous strikes against medical facilities, also in Tripoli, in late July 2019 conducted by the Libyan National Army in violation of international humanitarian law.”
Gazzini adds: “What emerges extremely clearly is also how damaging the 14 months war on Tripoli was – the majority of strikes and civilian casualties occurred within that time frame, in many cases by unknown actors.”
Violence towards civilians in Tripoli during the recent siege had also been visualised in detail for Airwars by Rectangle in innovative mapping.
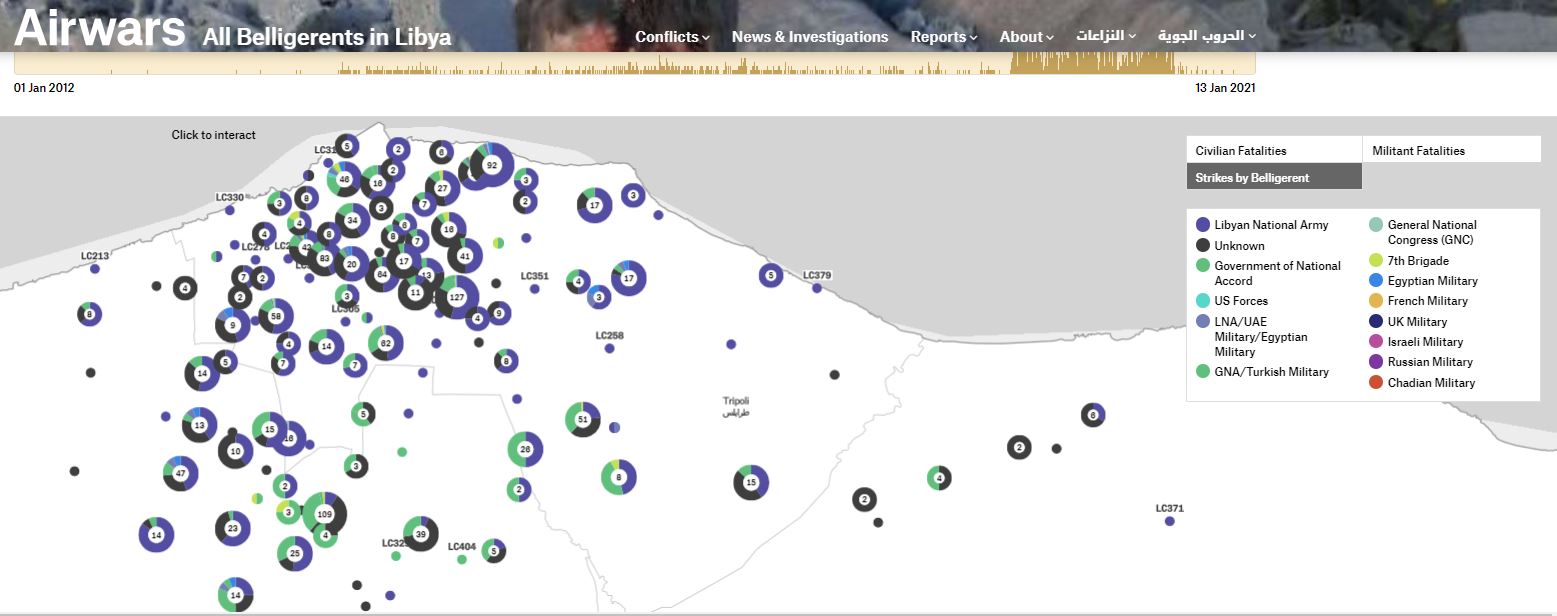
Detailed view of the Battle of Tripoli between April 2019 and June 2020
“What the data really shows us is the overall consistency and ubiquitousness (of the conflict). The data visualisation powerfully brings across how heavily Libya is affected by airstrikes,” says Trauthig.
She pointed out the tool enabled macro analysis of Libya’s war but would also help identify trends during specific time periods of intense conflict “such as the correlation between increased US airstrikes in Sirte with the fight against Islamic State.”
Clicking on the map reveals more detail about individual events, such as the suspected or known belligerent and any associated deaths. Civilian casualty incidents are also linked to the Airwars database, where more granular analysis can be found.
Arabic language researchers on the project included – among others – Osama Mansour, Shihab Halep and Mohammed al-Jumaily. Volunteers included Samuel Brownsword, Eleftheria Kousta, Douglas Statt, Vasiliki Touhouliotis and Anna Zahn. Clive Vella, Giacomo Nanni and Riley Mellen worked on the geolocation team.
New graphs compare strikes, civilian harm from Trump, Obama and Bush
Also being introduced by Airwars are new graphics comparing airstrike and reported civilian harm numbers grouped by US president – initially for the conflicts in Iraq and Syria, and in Somalia.
The US-led war against so-called Islamic State has seen more than 34,000 declared international air and artillery strikes since 2014. Using official Coalition data, Airwars modelling now shows that a slim majority of those strikes took place during Barack Obama’s second term. However more than twice the level of civilian harm was reported under Trump than Obama – partly a reflection of the intensity of the latter stages of the war, though also raising questions about possible relaxation of standards to protect non combatants.
In Somalia too, new graphics show that US actions against Al Shabaab under Donald Trump surged to their highest levels since counterterrorism actions began in 2007. Alleged civilian harm under Trump was more than double that of George W Bush and Barack Obama’s presidencies combined.

Despite a slim majority of declared strikes against ISIS taking place under Barack Obama, more than twice the level of civilian harm in Iraq and Syria was alleged from actions under Donald Trump.